FunkLoad bench report
| Date: | 2017-11-01 17:37:39 |
|---|
Abstract
Upload and download blobs Bench result of Blobs.test_download: Download blobs stress test
Table of contents
1 Bench configuration
- Launched: 2017-11-01 17:37:39
- From: pajeh
- Test: test_Blobs.py Blobs.test_download
- Target server: http://giraffe.cdev.bitmask.net:2424/
- Cycles of concurrent users: [25, 50, 75, 100, 125, 150, 175, 200]
- Cycle duration: 30s
- Sleeptime between requests: from 0.0s to 0.0s
- Sleeptime between test cases: 0.0s
- Startup delay between threads: 0.01s
- Apdex: 1.5
- FunkLoad version: 1.17.1
2 Bench content
The test Blobs.test_download contains:
- 1 page
- 0 redirects
- 0 links
- 0 images
- 0 XML-RPC calls
The bench contains:
- 17788 tests
- 17788 pages
- 17788 requests
3 Test stats
The number of Successful Tests Per Second (STPS) over Concurrent Users (CUs).
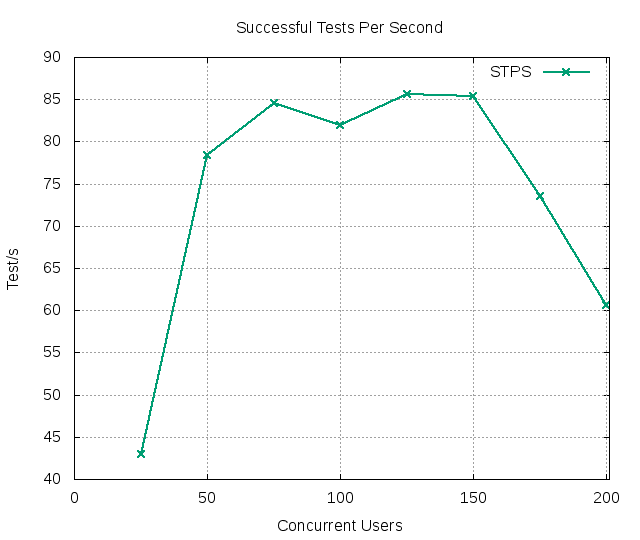
CUs STPS TOTAL SUCCESS ERROR 25 43.000 1290 1290 0.00% 50 78.433 2353 2353 0.00% 75 84.500 2535 2535 0.00% 100 81.900 2457 2457 0.00% 125 85.633 2569 2569 0.00% 150 85.367 2561 2561 0.00% 175 73.500 2205 2205 0.00% 200 60.600 1818 1818 0.00%
4 Page stats
The number of Successful Pages Per Second (SPPS) over Concurrent Users (CUs). Note: an XML-RPC call counts as a page.
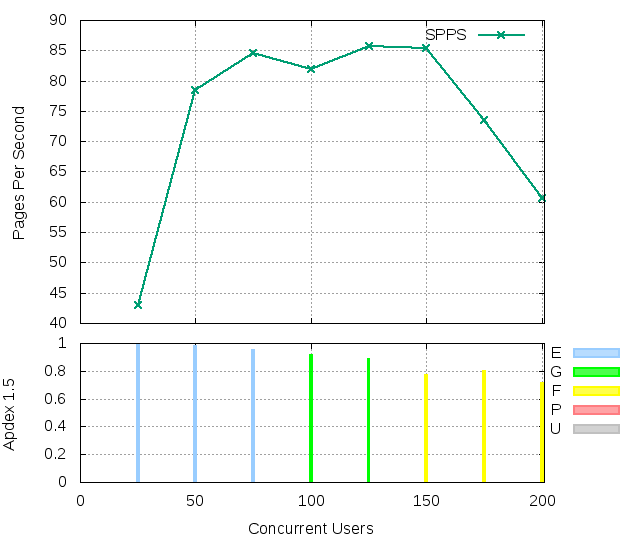
CUs Apdex* Rating SPPS maxSPPS TOTAL SUCCESS ERROR MIN AVG MAX P10 MED P90 P95 25 0.985 Excellent 43.000 50.000 1290 1290 0.00% 0.460 0.577 5.594 0.475 0.483 0.507 0.807 50 0.979 Excellent 78.433 100.000 2353 2353 0.00% 0.466 0.632 6.874 0.479 0.493 0.814 1.383 75 0.949 Excellent 84.500 146.000 2535 2535 0.00% 0.456 0.878 6.220 0.481 0.525 1.512 3.474 100 0.914 Good 81.900 185.000 2457 2457 0.00% 0.466 1.212 8.427 0.490 0.610 3.872 4.790 125 0.887 Good 85.633 206.000 2569 2569 0.00% 0.466 1.313 6.756 0.498 0.702 3.572 4.207 150 0.772 FAIR 85.367 300.000 2561 2561 0.00% 0.464 1.663 11.199 0.502 0.939 2.984 6.037 175 0.796 FAIR 73.500 318.000 2205 2205 0.00% 0.468 2.092 14.311 0.503 0.763 5.611 5.871 200 0.715 FAIR 60.600 350.000 1818 1818 0.00% 0.457 2.800 12.342 0.524 1.857 5.800 6.152 * Apdex 1.5
5 Request stats
The number of Requests Per Second (RPS) (successful or not) over Concurrent Users (CUs).
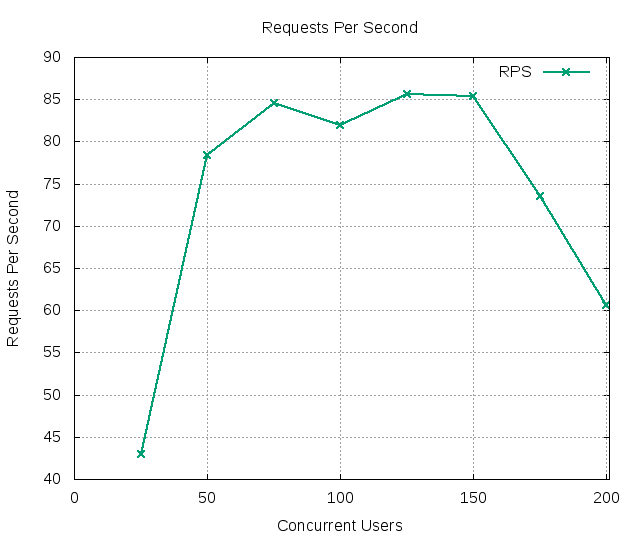
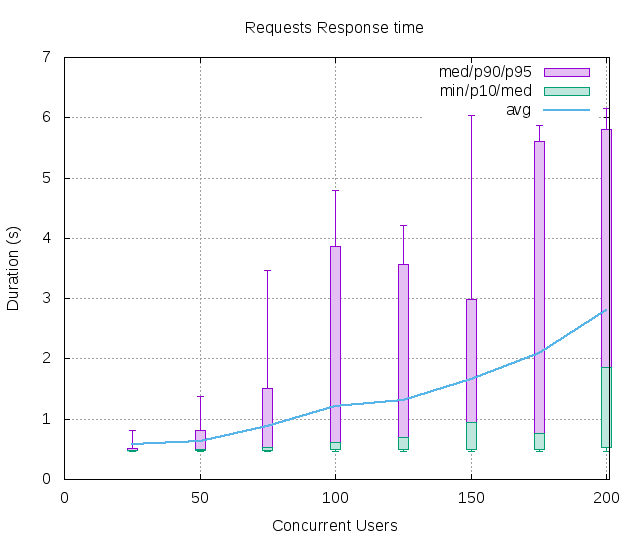
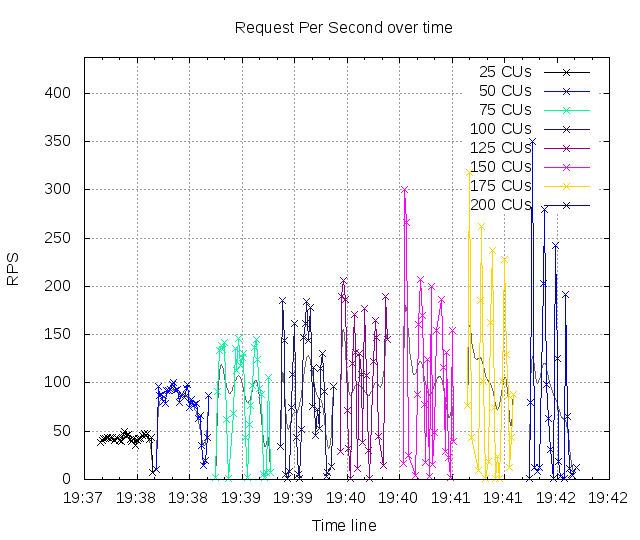
CUs Apdex* Rating* RPS maxRPS TOTAL SUCCESS ERROR MIN AVG MAX P10 MED P90 P95 25 0.985 Excellent 43.000 50.000 1290 1290 0.00% 0.460 0.577 5.594 0.475 0.483 0.507 0.807 50 0.979 Excellent 78.433 100.000 2353 2353 0.00% 0.466 0.632 6.874 0.479 0.493 0.814 1.383 75 0.949 Excellent 84.500 146.000 2535 2535 0.00% 0.456 0.878 6.220 0.481 0.525 1.512 3.474 100 0.914 Good 81.900 185.000 2457 2457 0.00% 0.466 1.212 8.427 0.490 0.610 3.872 4.790 125 0.887 Good 85.633 206.000 2569 2569 0.00% 0.466 1.313 6.756 0.498 0.702 3.572 4.207 150 0.772 FAIR 85.367 300.000 2561 2561 0.00% 0.464 1.663 11.199 0.502 0.939 2.984 6.037 175 0.796 FAIR 73.500 318.000 2205 2205 0.00% 0.468 2.092 14.311 0.503 0.763 5.611 5.871 200 0.715 FAIR 60.600 350.000 1818 1818 0.00% 0.457 2.800 12.342 0.524 1.857 5.800 6.152 * Apdex 1.5
6 Slowest requests
The 5 slowest average response time during the best cycle with 75 CUs:
- In page 001, Apdex rating: Excellent, avg response time: 0.88s, get: /blobs/0/1291 Download blob
7 Page detail stats
7.1 PAGE 001: Download blob
Req: 001, get, url /blobs/0/1290
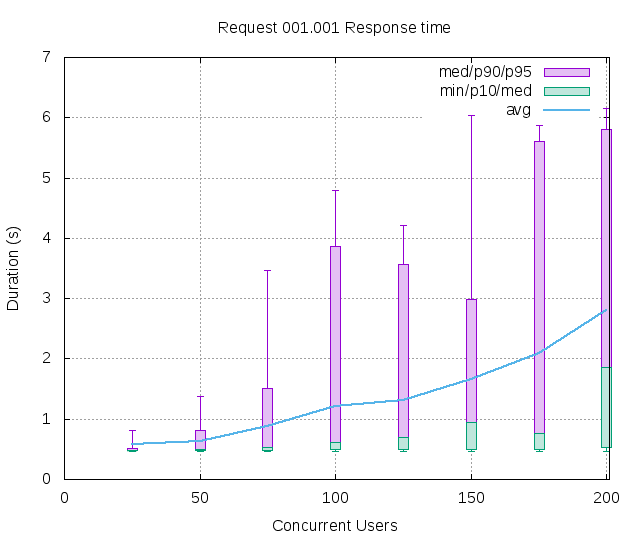
CUs Apdex* Rating TOTAL SUCCESS ERROR MIN AVG MAX P10 MED P90 P95 25 0.985 Excellent 1290 1290 0.00% 0.460 0.577 5.594 0.475 0.483 0.507 0.807 50 0.979 Excellent 2353 2353 0.00% 0.466 0.632 6.874 0.479 0.493 0.814 1.383 75 0.949 Excellent 2535 2535 0.00% 0.456 0.878 6.220 0.481 0.525 1.512 3.474 100 0.914 Good 2457 2457 0.00% 0.466 1.212 8.427 0.490 0.610 3.872 4.790 125 0.887 Good 2569 2569 0.00% 0.466 1.313 6.756 0.498 0.702 3.572 4.207 150 0.772 FAIR 2561 2561 0.00% 0.464 1.663 11.199 0.502 0.939 2.984 6.037 175 0.796 FAIR 2205 2205 0.00% 0.468 2.092 14.311 0.503 0.763 5.611 5.871 200 0.715 FAIR 1818 1818 0.00% 0.457 2.800 12.342 0.524 1.857 5.800 6.152 * Apdex 1.5
8 Definitions
CUs: Concurrent users or number of concurrent threads executing tests.
Request: a single GET/POST/redirect/XML-RPC request.
Page: a request with redirects and resource links (image, css, js) for an HTML page.
STPS: Successful tests per second.
SPPS: Successful pages per second.
RPS: Requests per second, successful or not.
maxSPPS: Maximum SPPS during the cycle.
maxRPS: Maximum RPS during the cycle.
MIN: Minimum response time for a page or request.
AVG: Average response time for a page or request.
MAX: Maximmum response time for a page or request.
P10: 10th percentile, response time where 10 percent of pages or requests are delivered.
MED: Median or 50th percentile, response time where half of pages or requests are delivered.
P90: 90th percentile, response time where 90 percent of pages or requests are delivered.
P95: 95th percentile, response time where 95 percent of pages or requests are delivered.
Apdex T: Application Performance Index, this is a numerical measure of user satisfaction, it is based on three zones of application responsiveness:
Satisfied: The user is fully productive. This represents the time value (T seconds) below which users are not impeded by application response time.
Tolerating: The user notices performance lagging within responses greater than T, but continues the process.
Frustrated: Performance with a response time greater than 4*T seconds is unacceptable, and users may abandon the process.
By default T is set to 1.5s. This means that response time between 0 and 1.5s the user is fully productive, between 1.5 and 6s the responsivness is tolerable and above 6s the user is frustrated.
The Apdex score converts many measurements into one number on a uniform scale of 0-to-1 (0 = no users satisfied, 1 = all users satisfied).
Visit http://www.apdex.org/ for more information.
Rating: To ease interpretation, the Apdex score is also represented as a rating:
- U for UNACCEPTABLE represented in gray for a score between 0 and 0.5
- P for POOR represented in red for a score between 0.5 and 0.7
- F for FAIR represented in yellow for a score between 0.7 and 0.85
- G for Good represented in green for a score between 0.85 and 0.94
- E for Excellent represented in blue for a score between 0.94 and 1.
Report generated with FunkLoad 1.17.1, more information available on the FunkLoad site.