FunkLoad bench report
| Date: | 2017-11-01 18:38:40 |
|---|
Abstract
Upload and download blobs Bench result of Blobs.test_download: Download blobs stress test
Table of contents
1 Bench configuration
- Launched: 2017-11-01 18:38:40
- From: pajeh
- Test: test_Blobs.py Blobs.test_download
- Target server: http://giraffe.cdev.bitmask.net:2424/
- Cycles of concurrent users: [25, 50, 75, 100, 125, 150, 175, 200]
- Cycle duration: 30s
- Sleeptime between requests: from 0.0s to 0.0s
- Sleeptime between test cases: 0.0s
- Startup delay between threads: 0.01s
- Apdex: 1.5
- FunkLoad version: 1.17.1
2 Bench content
The test Blobs.test_download contains:
- 1 page
- 0 redirects
- 0 links
- 0 images
- 0 XML-RPC calls
The bench contains:
- 11945 tests
- 11945 pages
- 11945 requests
3 Test stats
The number of Successful Tests Per Second (STPS) over Concurrent Users (CUs).
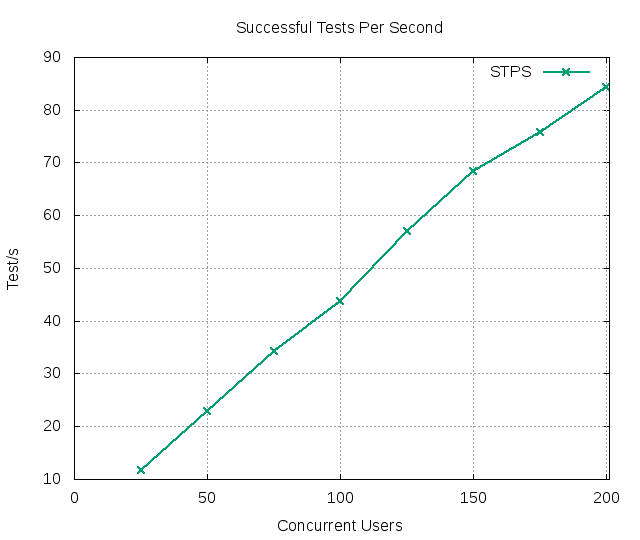
CUs STPS TOTAL SUCCESS ERROR 25 11.767 353 353 0.00% 50 22.900 687 687 0.00% 75 34.333 1030 1030 0.00% 100 43.700 1311 1311 0.00% 125 57.033 1711 1711 0.00% 150 68.400 2052 2052 0.00% 175 75.800 2274 2274 0.00% 200 84.233 2527 2527 0.00%
4 Page stats
The number of Successful Pages Per Second (SPPS) over Concurrent Users (CUs). Note: an XML-RPC call counts as a page.
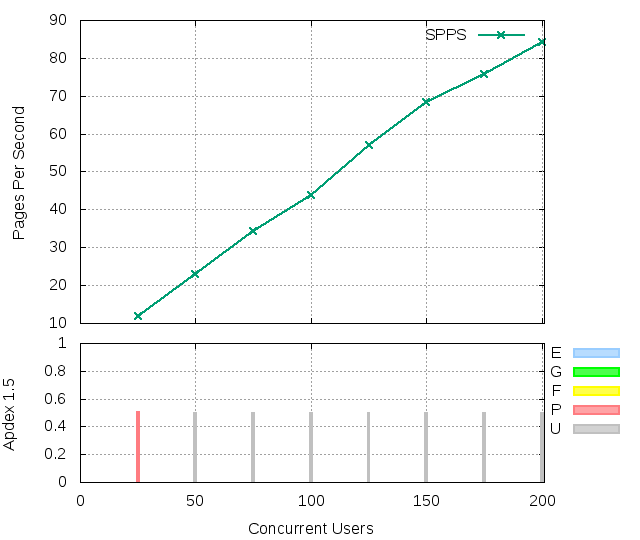
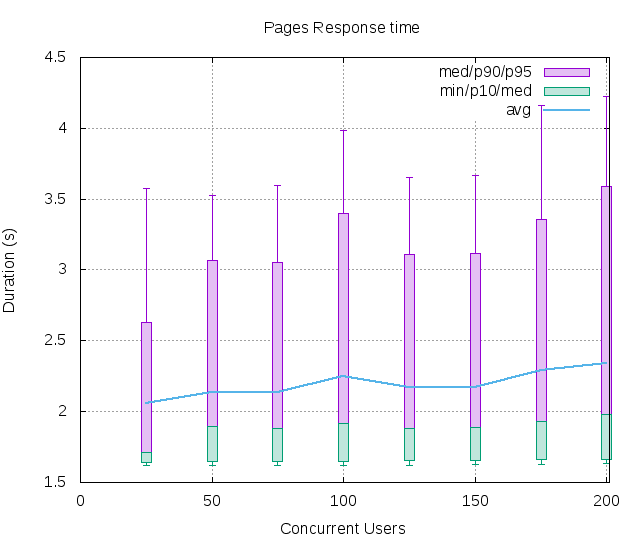
CUs Apdex* Rating SPPS maxSPPS TOTAL SUCCESS ERROR MIN AVG MAX P10 MED P90 P95 25 0.500 POOR 11.767 25.000 353 353 0.00% 1.620 2.059 5.228 1.641 1.709 2.632 3.575 50 0.498 UNACCEPTABLE 22.900 36.000 687 687 0.00% 1.622 2.138 7.190 1.646 1.896 3.070 3.528 75 0.499 UNACCEPTABLE 34.333 46.000 1030 1030 0.00% 1.622 2.135 7.368 1.651 1.878 3.052 3.599 100 0.499 UNACCEPTABLE 43.700 59.000 1311 1311 0.00% 1.621 2.251 7.396 1.650 1.919 3.398 3.986 125 0.499 UNACCEPTABLE 57.033 69.000 1711 1711 0.00% 1.621 2.167 7.166 1.653 1.881 3.109 3.656 150 0.499 UNACCEPTABLE 68.400 83.000 2052 2052 0.00% 1.629 2.173 10.146 1.657 1.887 3.119 3.664 175 0.497 UNACCEPTABLE 75.800 95.000 2274 2274 0.00% 1.629 2.290 8.848 1.660 1.930 3.356 4.165 200 0.497 UNACCEPTABLE 84.233 122.000 2527 2527 0.00% 1.633 2.341 9.779 1.664 1.977 3.589 4.225 * Apdex 1.5
5 Request stats
The number of Requests Per Second (RPS) (successful or not) over Concurrent Users (CUs).
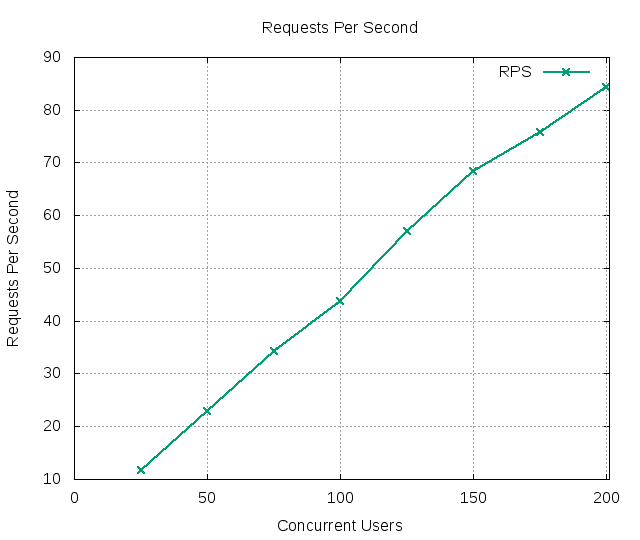
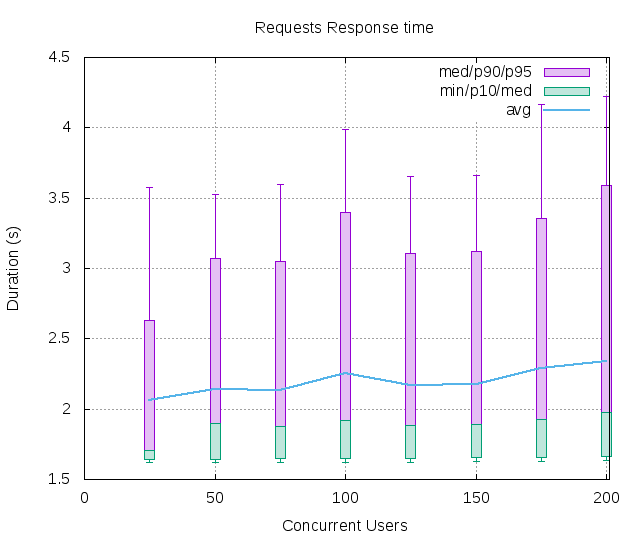
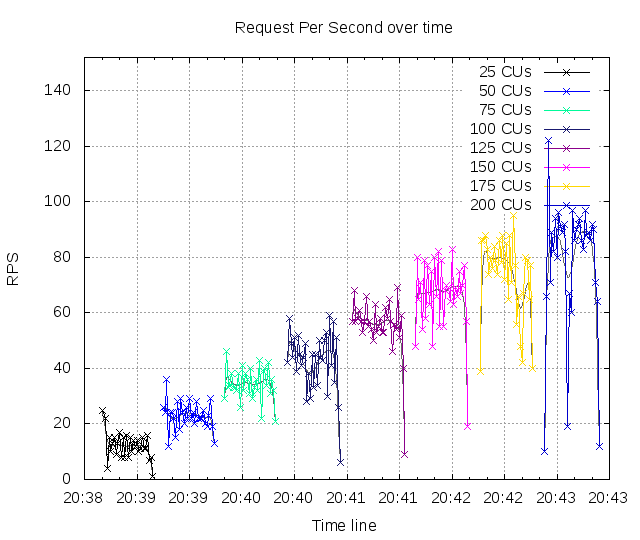
CUs Apdex* Rating* RPS maxRPS TOTAL SUCCESS ERROR MIN AVG MAX P10 MED P90 P95 25 0.500 POOR 11.767 25.000 353 353 0.00% 1.620 2.059 5.228 1.641 1.709 2.632 3.575 50 0.498 UNACCEPTABLE 22.900 36.000 687 687 0.00% 1.622 2.138 7.190 1.646 1.896 3.070 3.528 75 0.499 UNACCEPTABLE 34.333 46.000 1030 1030 0.00% 1.622 2.135 7.368 1.651 1.878 3.052 3.599 100 0.499 UNACCEPTABLE 43.700 59.000 1311 1311 0.00% 1.621 2.251 7.396 1.650 1.919 3.398 3.986 125 0.499 UNACCEPTABLE 57.033 69.000 1711 1711 0.00% 1.621 2.167 7.166 1.653 1.881 3.109 3.656 150 0.499 UNACCEPTABLE 68.400 83.000 2052 2052 0.00% 1.629 2.173 10.146 1.657 1.887 3.119 3.664 175 0.497 UNACCEPTABLE 75.800 95.000 2274 2274 0.00% 1.629 2.290 8.848 1.660 1.930 3.356 4.165 200 0.497 UNACCEPTABLE 84.233 122.000 2527 2527 0.00% 1.633 2.341 9.779 1.664 1.977 3.589 4.225 * Apdex 1.5
6 Slowest requests
The 5 slowest average response time during the best cycle with 25 CUs:
- In page 001, Apdex rating: POOR, avg response time: 2.06s, get: /blobs/0/354 Download blob
7 Page detail stats
7.1 PAGE 001: Download blob
Req: 001, get, url /blobs/0/354
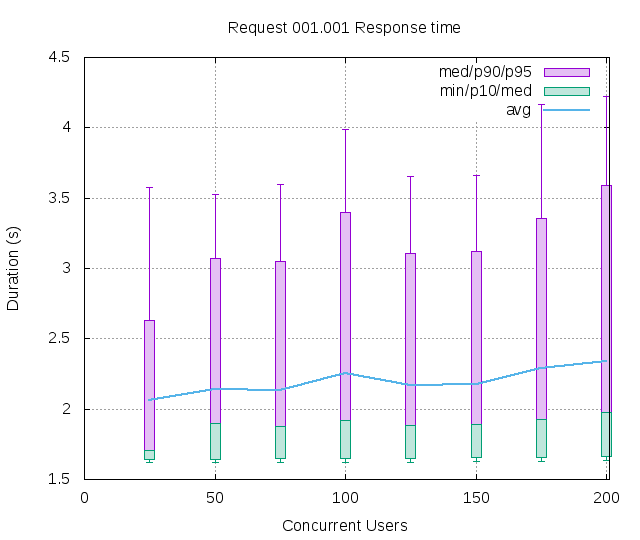
CUs Apdex* Rating TOTAL SUCCESS ERROR MIN AVG MAX P10 MED P90 P95 25 0.500 POOR 353 353 0.00% 1.620 2.059 5.228 1.641 1.709 2.632 3.575 50 0.498 UNACCEPTABLE 687 687 0.00% 1.622 2.138 7.190 1.646 1.896 3.070 3.528 75 0.499 UNACCEPTABLE 1030 1030 0.00% 1.622 2.135 7.368 1.651 1.878 3.052 3.599 100 0.499 UNACCEPTABLE 1311 1311 0.00% 1.621 2.251 7.396 1.650 1.919 3.398 3.986 125 0.499 UNACCEPTABLE 1711 1711 0.00% 1.621 2.167 7.166 1.653 1.881 3.109 3.656 150 0.499 UNACCEPTABLE 2052 2052 0.00% 1.629 2.173 10.146 1.657 1.887 3.119 3.664 175 0.497 UNACCEPTABLE 2274 2274 0.00% 1.629 2.290 8.848 1.660 1.930 3.356 4.165 200 0.497 UNACCEPTABLE 2527 2527 0.00% 1.633 2.341 9.779 1.664 1.977 3.589 4.225 * Apdex 1.5
8 Definitions
CUs: Concurrent users or number of concurrent threads executing tests.
Request: a single GET/POST/redirect/XML-RPC request.
Page: a request with redirects and resource links (image, css, js) for an HTML page.
STPS: Successful tests per second.
SPPS: Successful pages per second.
RPS: Requests per second, successful or not.
maxSPPS: Maximum SPPS during the cycle.
maxRPS: Maximum RPS during the cycle.
MIN: Minimum response time for a page or request.
AVG: Average response time for a page or request.
MAX: Maximmum response time for a page or request.
P10: 10th percentile, response time where 10 percent of pages or requests are delivered.
MED: Median or 50th percentile, response time where half of pages or requests are delivered.
P90: 90th percentile, response time where 90 percent of pages or requests are delivered.
P95: 95th percentile, response time where 95 percent of pages or requests are delivered.
Apdex T: Application Performance Index, this is a numerical measure of user satisfaction, it is based on three zones of application responsiveness:
Satisfied: The user is fully productive. This represents the time value (T seconds) below which users are not impeded by application response time.
Tolerating: The user notices performance lagging within responses greater than T, but continues the process.
Frustrated: Performance with a response time greater than 4*T seconds is unacceptable, and users may abandon the process.
By default T is set to 1.5s. This means that response time between 0 and 1.5s the user is fully productive, between 1.5 and 6s the responsivness is tolerable and above 6s the user is frustrated.
The Apdex score converts many measurements into one number on a uniform scale of 0-to-1 (0 = no users satisfied, 1 = all users satisfied).
Visit http://www.apdex.org/ for more information.
Rating: To ease interpretation, the Apdex score is also represented as a rating:
- U for UNACCEPTABLE represented in gray for a score between 0 and 0.5
- P for POOR represented in red for a score between 0.5 and 0.7
- F for FAIR represented in yellow for a score between 0.7 and 0.85
- G for Good represented in green for a score between 0.85 and 0.94
- E for Excellent represented in blue for a score between 0.94 and 1.
Report generated with FunkLoad 1.17.1, more information available on the FunkLoad site.