FunkLoad bench report
| Date: | 2017-11-03 13:48:28 |
|---|
Abstract
Upload and download blobs Bench result of Blobs.test_download: Download blobs stress test
Table of contents
1 Bench configuration
- Launched: 2017-11-03 13:48:28
- From: lynx
- Test: test_Blobs.py Blobs.test_download
- Target server: http://giraffe.cdev.bitmask.net:2424/
- Cycles of concurrent users: [25, 50, 75, 100, 125, 150, 175, 200]
- Cycle duration: 30s
- Sleeptime between requests: from 0.0s to 0.0s
- Sleeptime between test cases: 0.0s
- Startup delay between threads: 0.01s
- Apdex: 1.5
- FunkLoad version: 1.17.2
2 Bench content
The test Blobs.test_download contains:
- 1 page
- 0 redirects
- 0 links
- 0 images
- 0 XML-RPC calls
The bench contains:
- 77813 tests
- 78079 pages
- 78079 requests
3 Test stats
The number of Successful Tests Per Second (STPS) over Concurrent Users (CUs).
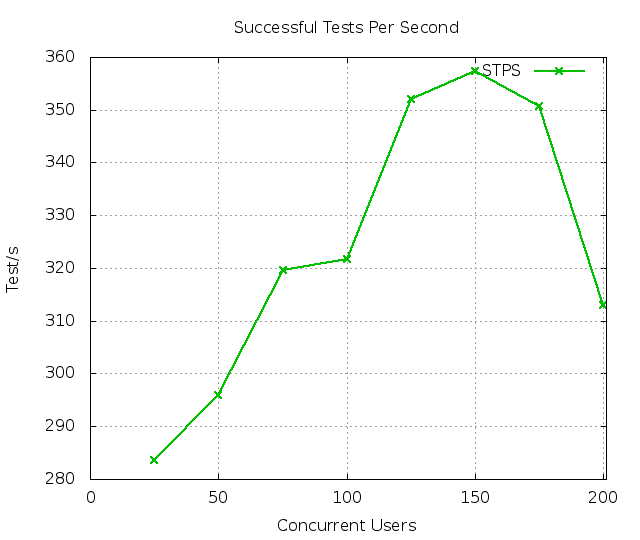
CUs STPS TOTAL SUCCESS ERROR 25 283.533 8506 8506 0.00% 50 295.967 8879 8879 0.00% 75 319.600 9588 9588 0.00% 100 321.633 9649 9649 0.00% 125 352.033 10561 10561 0.00% 150 357.333 10720 10720 0.00% 175 350.667 10520 10520 0.00% 200 313.000 9390 9390 0.00%
4 Page stats
The number of Successful Pages Per Second (SPPS) over Concurrent Users (CUs). Note: an XML-RPC call counts as a page.
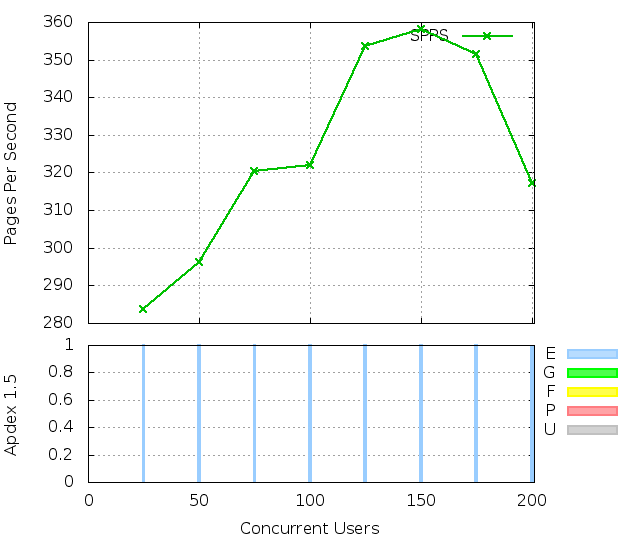
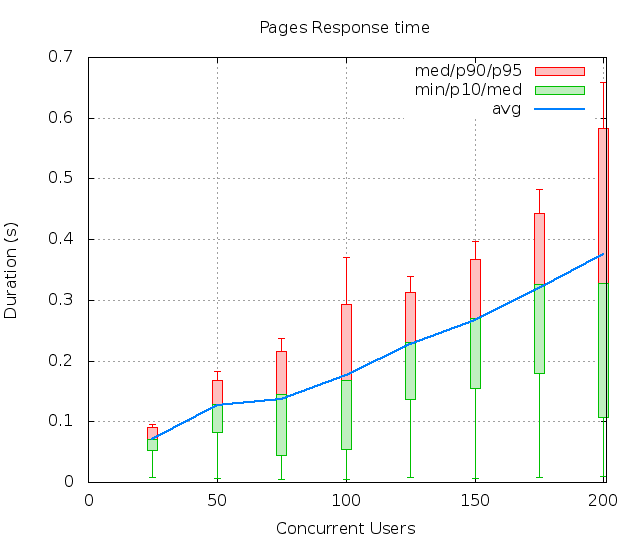
CUs Apdex* Rating SPPS maxSPPS TOTAL SUCCESS ERROR MIN AVG MAX P10 MED P90 P95 25 1.000 Excellent 283.667 305.000 8510 8510 0.00% 0.007 0.071 0.173 0.052 0.071 0.090 0.096 50 1.000 Excellent 296.100 316.000 8883 8883 0.00% 0.007 0.127 0.337 0.082 0.128 0.169 0.182 75 1.000 Excellent 320.400 352.000 9612 9612 0.00% 0.004 0.137 0.467 0.044 0.144 0.216 0.238 100 1.000 Excellent 322.000 381.000 9660 9660 0.00% 0.005 0.176 1.358 0.054 0.167 0.294 0.371 125 1.000 Excellent 353.567 383.000 10607 10607 0.00% 0.008 0.227 0.653 0.136 0.231 0.312 0.339 150 1.000 Excellent 358.200 405.000 10746 10746 0.00% 0.006 0.266 1.411 0.154 0.270 0.368 0.398 175 1.000 Excellent 351.367 397.000 10541 10541 0.00% 0.008 0.320 0.973 0.180 0.326 0.443 0.482 200 0.990 Excellent 317.333 407.000 9520 9520 0.00% 0.010 0.375 3.642 0.106 0.328 0.584 0.659 * Apdex 1.5
5 Request stats
The number of Requests Per Second (RPS) (successful or not) over Concurrent Users (CUs).
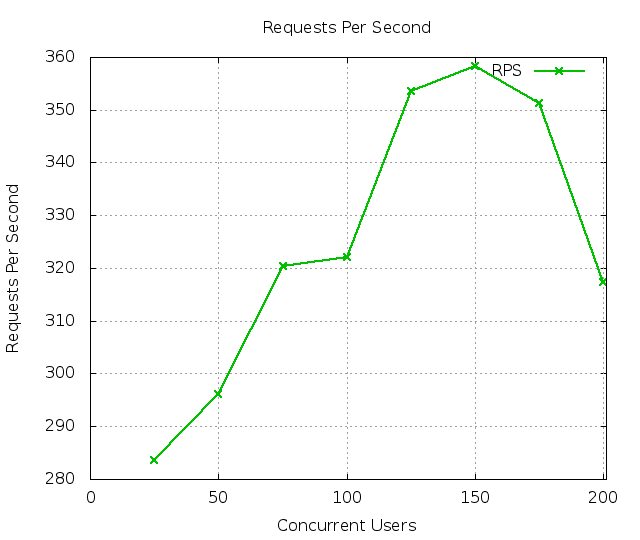
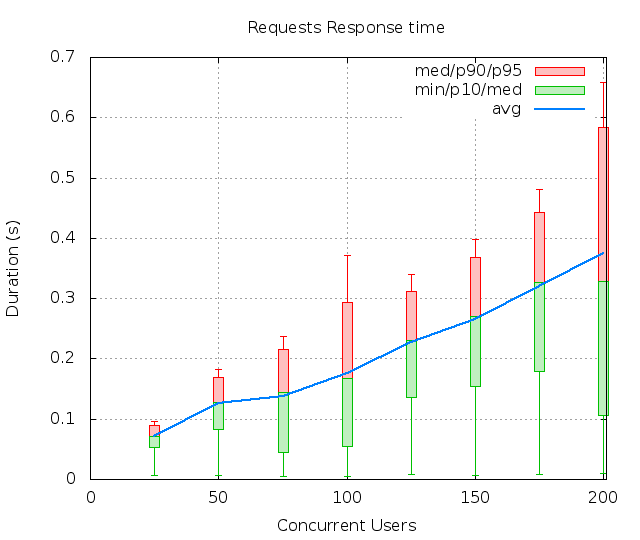
CUs Apdex* Rating* RPS maxRPS TOTAL SUCCESS ERROR MIN AVG MAX P10 MED P90 P95 25 1.000 Excellent 283.667 305.000 8510 8510 0.00% 0.007 0.071 0.173 0.052 0.071 0.090 0.096 50 1.000 Excellent 296.100 316.000 8883 8883 0.00% 0.007 0.127 0.337 0.082 0.128 0.169 0.182 75 1.000 Excellent 320.400 352.000 9612 9612 0.00% 0.004 0.137 0.467 0.044 0.144 0.216 0.238 100 1.000 Excellent 322.000 381.000 9660 9660 0.00% 0.005 0.176 1.358 0.054 0.167 0.294 0.371 125 1.000 Excellent 353.567 383.000 10607 10607 0.00% 0.008 0.227 0.653 0.136 0.231 0.312 0.339 150 1.000 Excellent 358.200 405.000 10746 10746 0.00% 0.006 0.266 1.411 0.154 0.270 0.368 0.398 175 1.000 Excellent 351.367 397.000 10541 10541 0.00% 0.008 0.320 0.973 0.180 0.326 0.443 0.482 200 0.990 Excellent 317.333 407.000 9520 9520 0.00% 0.010 0.375 3.642 0.106 0.328 0.584 0.659 * Apdex 1.5
6 Slowest requests
The 5 slowest average response time during the best cycle with 150 CUs:
- In page 001, Apdex rating: Excellent, avg response time: 0.27s, get: /blobs/0/1296 Download blob
7 Page detail stats
7.1 PAGE 001: Download blob
Req: 001, get, url /blobs/0/3715
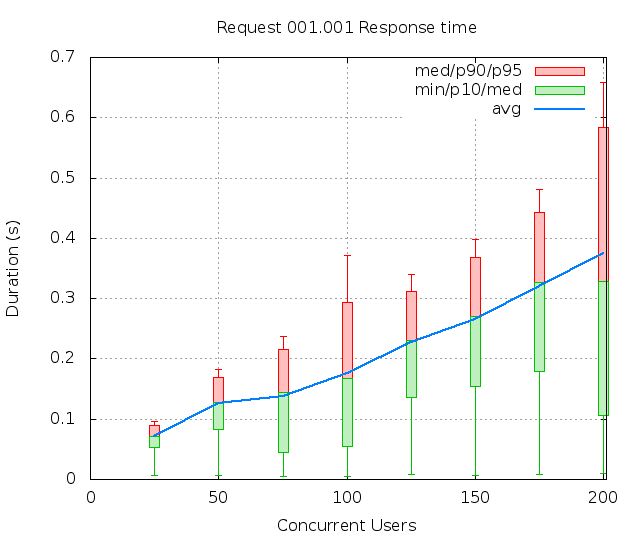
CUs Apdex* Rating TOTAL SUCCESS ERROR MIN AVG MAX P10 MED P90 P95 25 1.000 Excellent 8510 8510 0.00% 0.007 0.071 0.173 0.052 0.071 0.090 0.096 50 1.000 Excellent 8883 8883 0.00% 0.007 0.127 0.337 0.082 0.128 0.169 0.182 75 1.000 Excellent 9612 9612 0.00% 0.004 0.137 0.467 0.044 0.144 0.216 0.238 100 1.000 Excellent 9660 9660 0.00% 0.005 0.176 1.358 0.054 0.167 0.294 0.371 125 1.000 Excellent 10607 10607 0.00% 0.008 0.227 0.653 0.136 0.231 0.312 0.339 150 1.000 Excellent 10746 10746 0.00% 0.006 0.266 1.411 0.154 0.270 0.368 0.398 175 1.000 Excellent 10541 10541 0.00% 0.008 0.320 0.973 0.180 0.326 0.443 0.482 200 0.990 Excellent 9520 9520 0.00% 0.010 0.375 3.642 0.106 0.328 0.584 0.659 * Apdex 1.5
8 Definitions
CUs: Concurrent users or number of concurrent threads executing tests.
Request: a single GET/POST/redirect/XML-RPC request.
Page: a request with redirects and resource links (image, css, js) for an HTML page.
STPS: Successful tests per second.
SPPS: Successful pages per second.
RPS: Requests per second, successful or not.
maxSPPS: Maximum SPPS during the cycle.
maxRPS: Maximum RPS during the cycle.
MIN: Minimum response time for a page or request.
AVG: Average response time for a page or request.
MAX: Maximmum response time for a page or request.
P10: 10th percentile, response time where 10 percent of pages or requests are delivered.
MED: Median or 50th percentile, response time where half of pages or requests are delivered.
P90: 90th percentile, response time where 90 percent of pages or requests are delivered.
P95: 95th percentile, response time where 95 percent of pages or requests are delivered.
Apdex T: Application Performance Index, this is a numerical measure of user satisfaction, it is based on three zones of application responsiveness:
Satisfied: The user is fully productive. This represents the time value (T seconds) below which users are not impeded by application response time.
Tolerating: The user notices performance lagging within responses greater than T, but continues the process.
Frustrated: Performance with a response time greater than 4*T seconds is unacceptable, and users may abandon the process.
By default T is set to 1.5s. This means that response time between 0 and 1.5s the user is fully productive, between 1.5 and 6s the responsivness is tolerable and above 6s the user is frustrated.
The Apdex score converts many measurements into one number on a uniform scale of 0-to-1 (0 = no users satisfied, 1 = all users satisfied).
Visit http://www.apdex.org/ for more information.
Rating: To ease interpretation, the Apdex score is also represented as a rating:
- U for UNACCEPTABLE represented in gray for a score between 0 and 0.5
- P for POOR represented in red for a score between 0.5 and 0.7
- F for FAIR represented in yellow for a score between 0.7 and 0.85
- G for Good represented in green for a score between 0.85 and 0.94
- E for Excellent represented in blue for a score between 0.94 and 1.
Report generated with FunkLoad 1.17.2, more information available on the FunkLoad site.